Monitor Che server
The Che server exposes JVM metrics such as memory usage and class loading on port 8087 on the /metrics endpoint. Monitoring these metrics helps administrators identify performance bottlenecks and plan server capacity.
Enable Che server metrics
Che exposes the JVM metrics on port 8087 of the che-host Service. Configure this behavior to support performance monitoring and capacity planning.
-
An active
kubectlsession with administrative permissions to the destination Kubernetes cluster. See Overview of kubectl.
-
Configure the
CheClusterCustom Resource. See Using the CLI to configure the CheCluster Custom Resource.spec: components: metrics: enable: <boolean> (1)1 trueto enable,falseto disable.
-
Verify the metrics endpoint is accessible:
$ kubectl get service che-host -n eclipse-che -o jsonpath='{.spec.ports[?(@.port==8087)]}'
Verify Che server metrics with Prometheus
Verify that Che Server JVM metrics are available in Prometheus. The che-operator automatically creates and reconciles the required Prometheus resources (ServiceMonitor, Role, and RoleBinding) and configures namespace labeling.
-
In the Administrator view of the OpenShift web console, go to Observe → Metrics.
-
Run a PromQL query to confirm that the metrics are available. For example, enter
process_uptime_seconds{job="che-host"}and click Run queries.
|
To troubleshoot missing metrics, view the Prometheus container logs for possible RBAC-related errors:
|
View Che Server from an Kubernetes web console dashboard
View Che Server JVM metrics on a custom dashboard in the Administrator perspective of the Kubernetes web console. This dashboard helps you identify performance bottlenecks and monitor server health.
-
Che is installed and running on a Red Hat OpenShift cluster.
-
An active
ocsession with administrative permissions to the destination OpenShift cluster. See Getting started with the CLI. -
The in-cluster Prometheus instance is collecting metrics. See Verify Che server metrics with Prometheus.
-
Create a ConfigMap for the dashboard definition in the
openshift-config-managednamespace and apply the necessary label.-
$ oc create configmap grafana-dashboard-devspaces-server \ --from-literal=devspaces-server-dashboard.json="$(curl https://raw.githubusercontent.com/eclipse-che/che-server/main/docs/grafana/openshift-console-dashboard.json)" \ -n openshift-config-managed -
$ oc label configmap grafana-dashboard-devspaces-server console.openshift.io/dashboard=true -n openshift-config-managedThe dashboard definition is based on Grafana 6.x dashboards. Not all Grafana 6.x dashboard features are supported in the OpenShift web console.
-
-
In the Administrator view of the OpenShift web console, go to Observe → Dashboards.
-
Go to Dashboard → Che Server JVM and verify that the dashboard panels contain data.
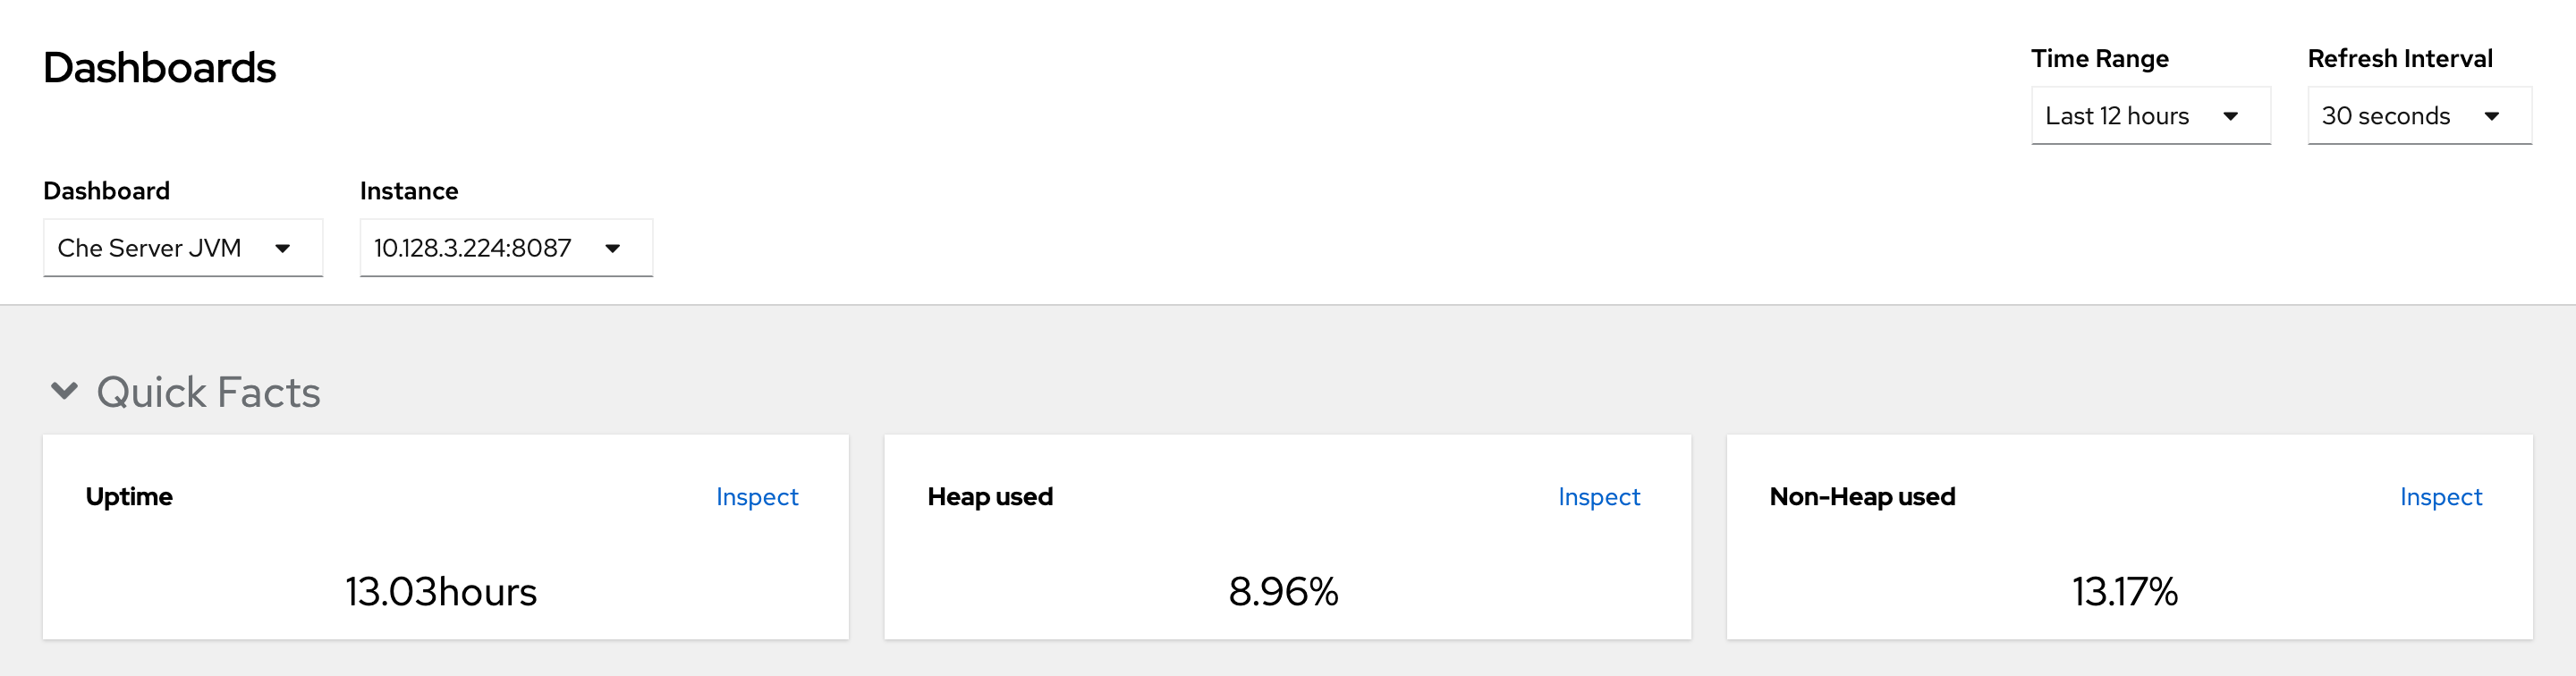 Figure 1. Quick Facts
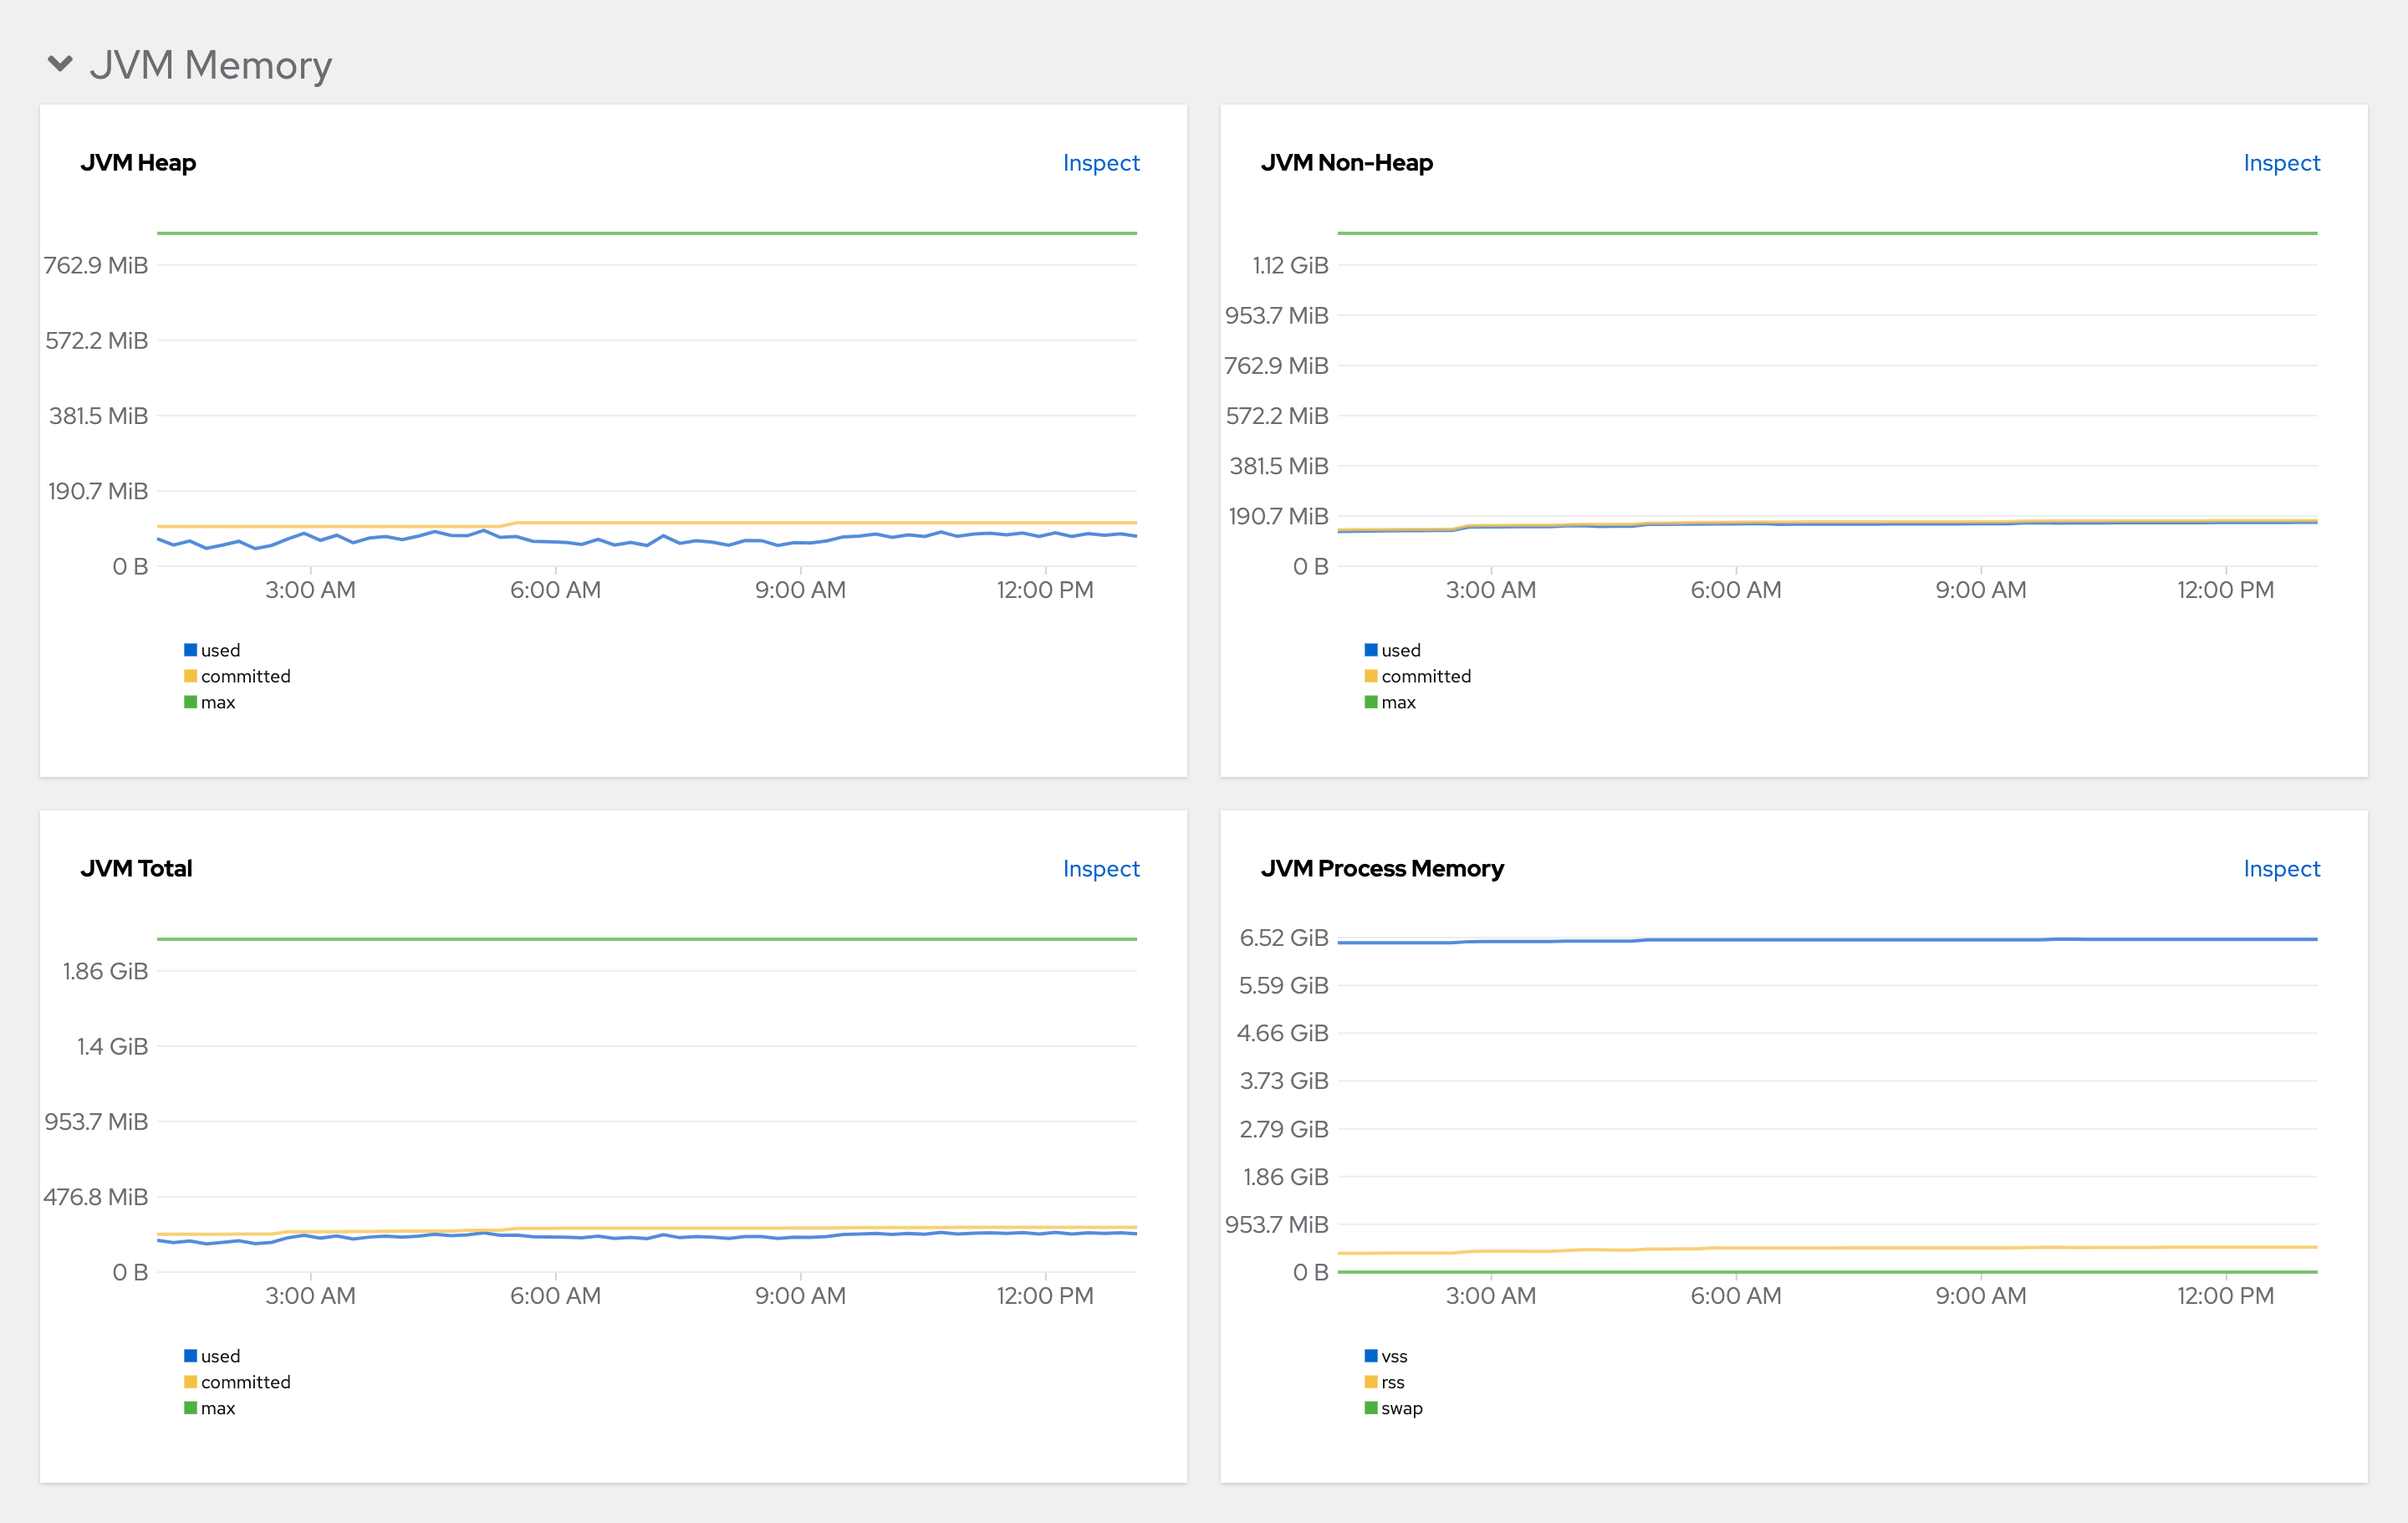 Figure 2. JVM Memory
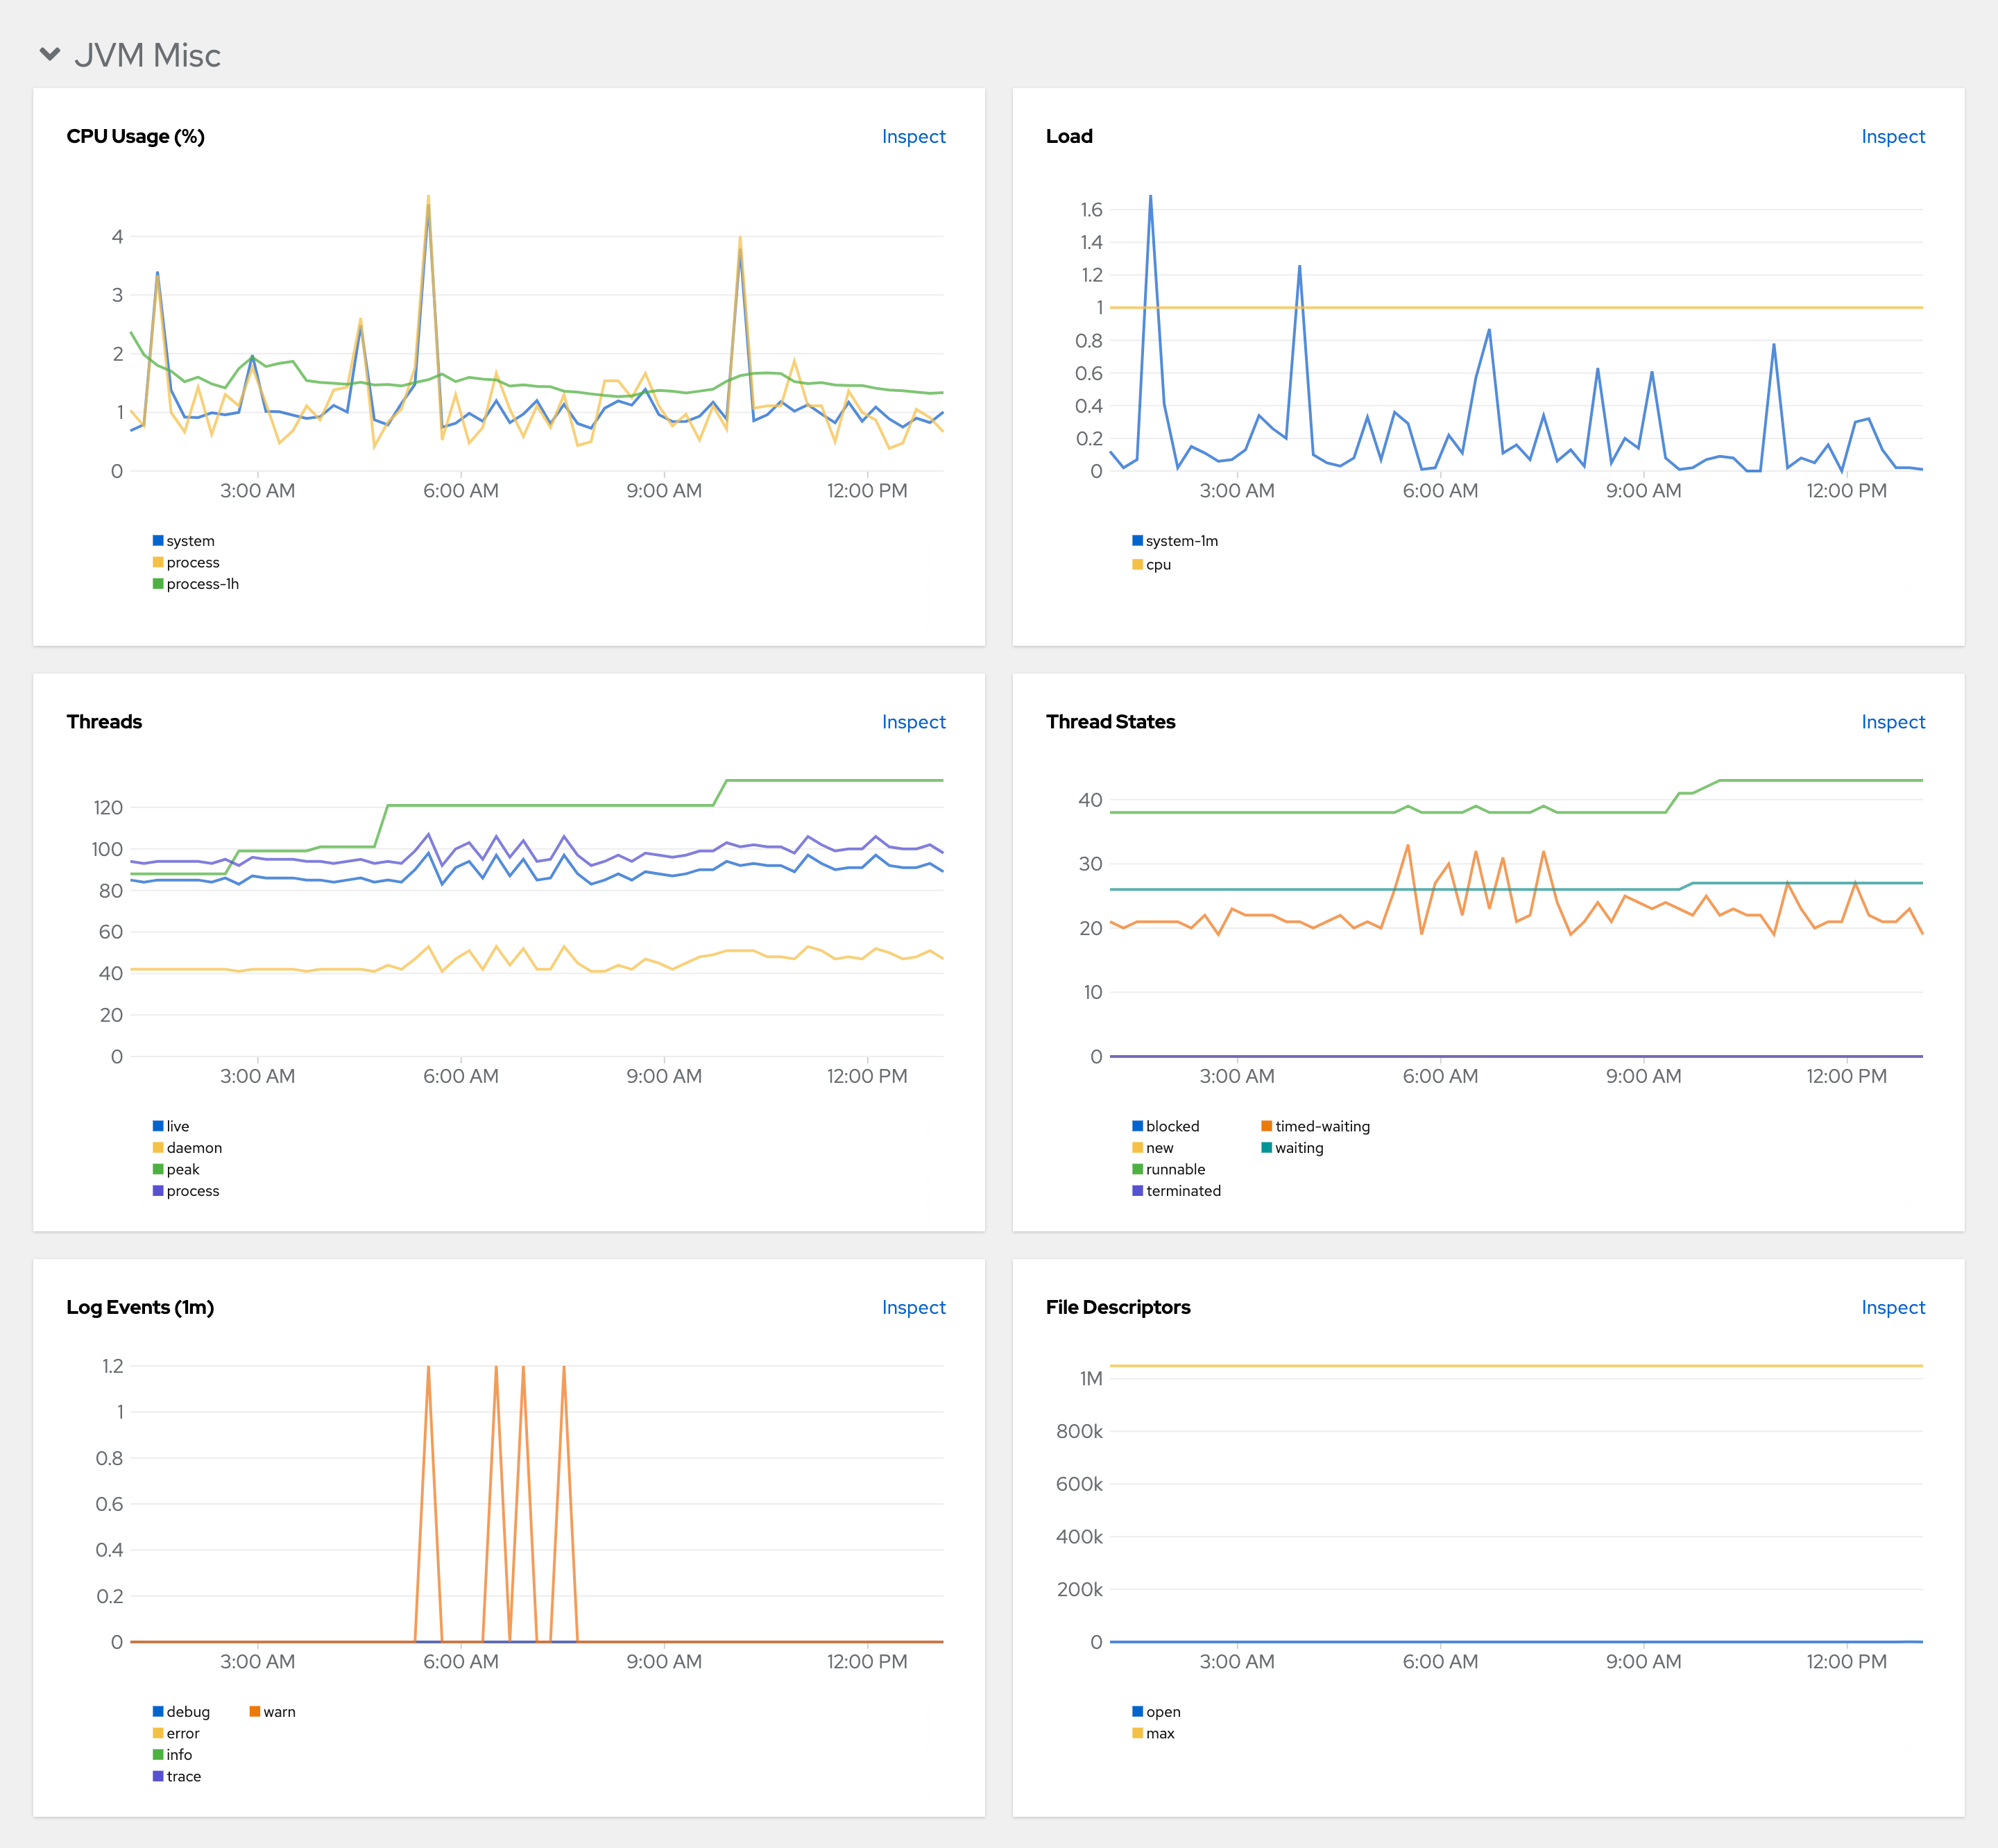 Figure 3. JVM Misc
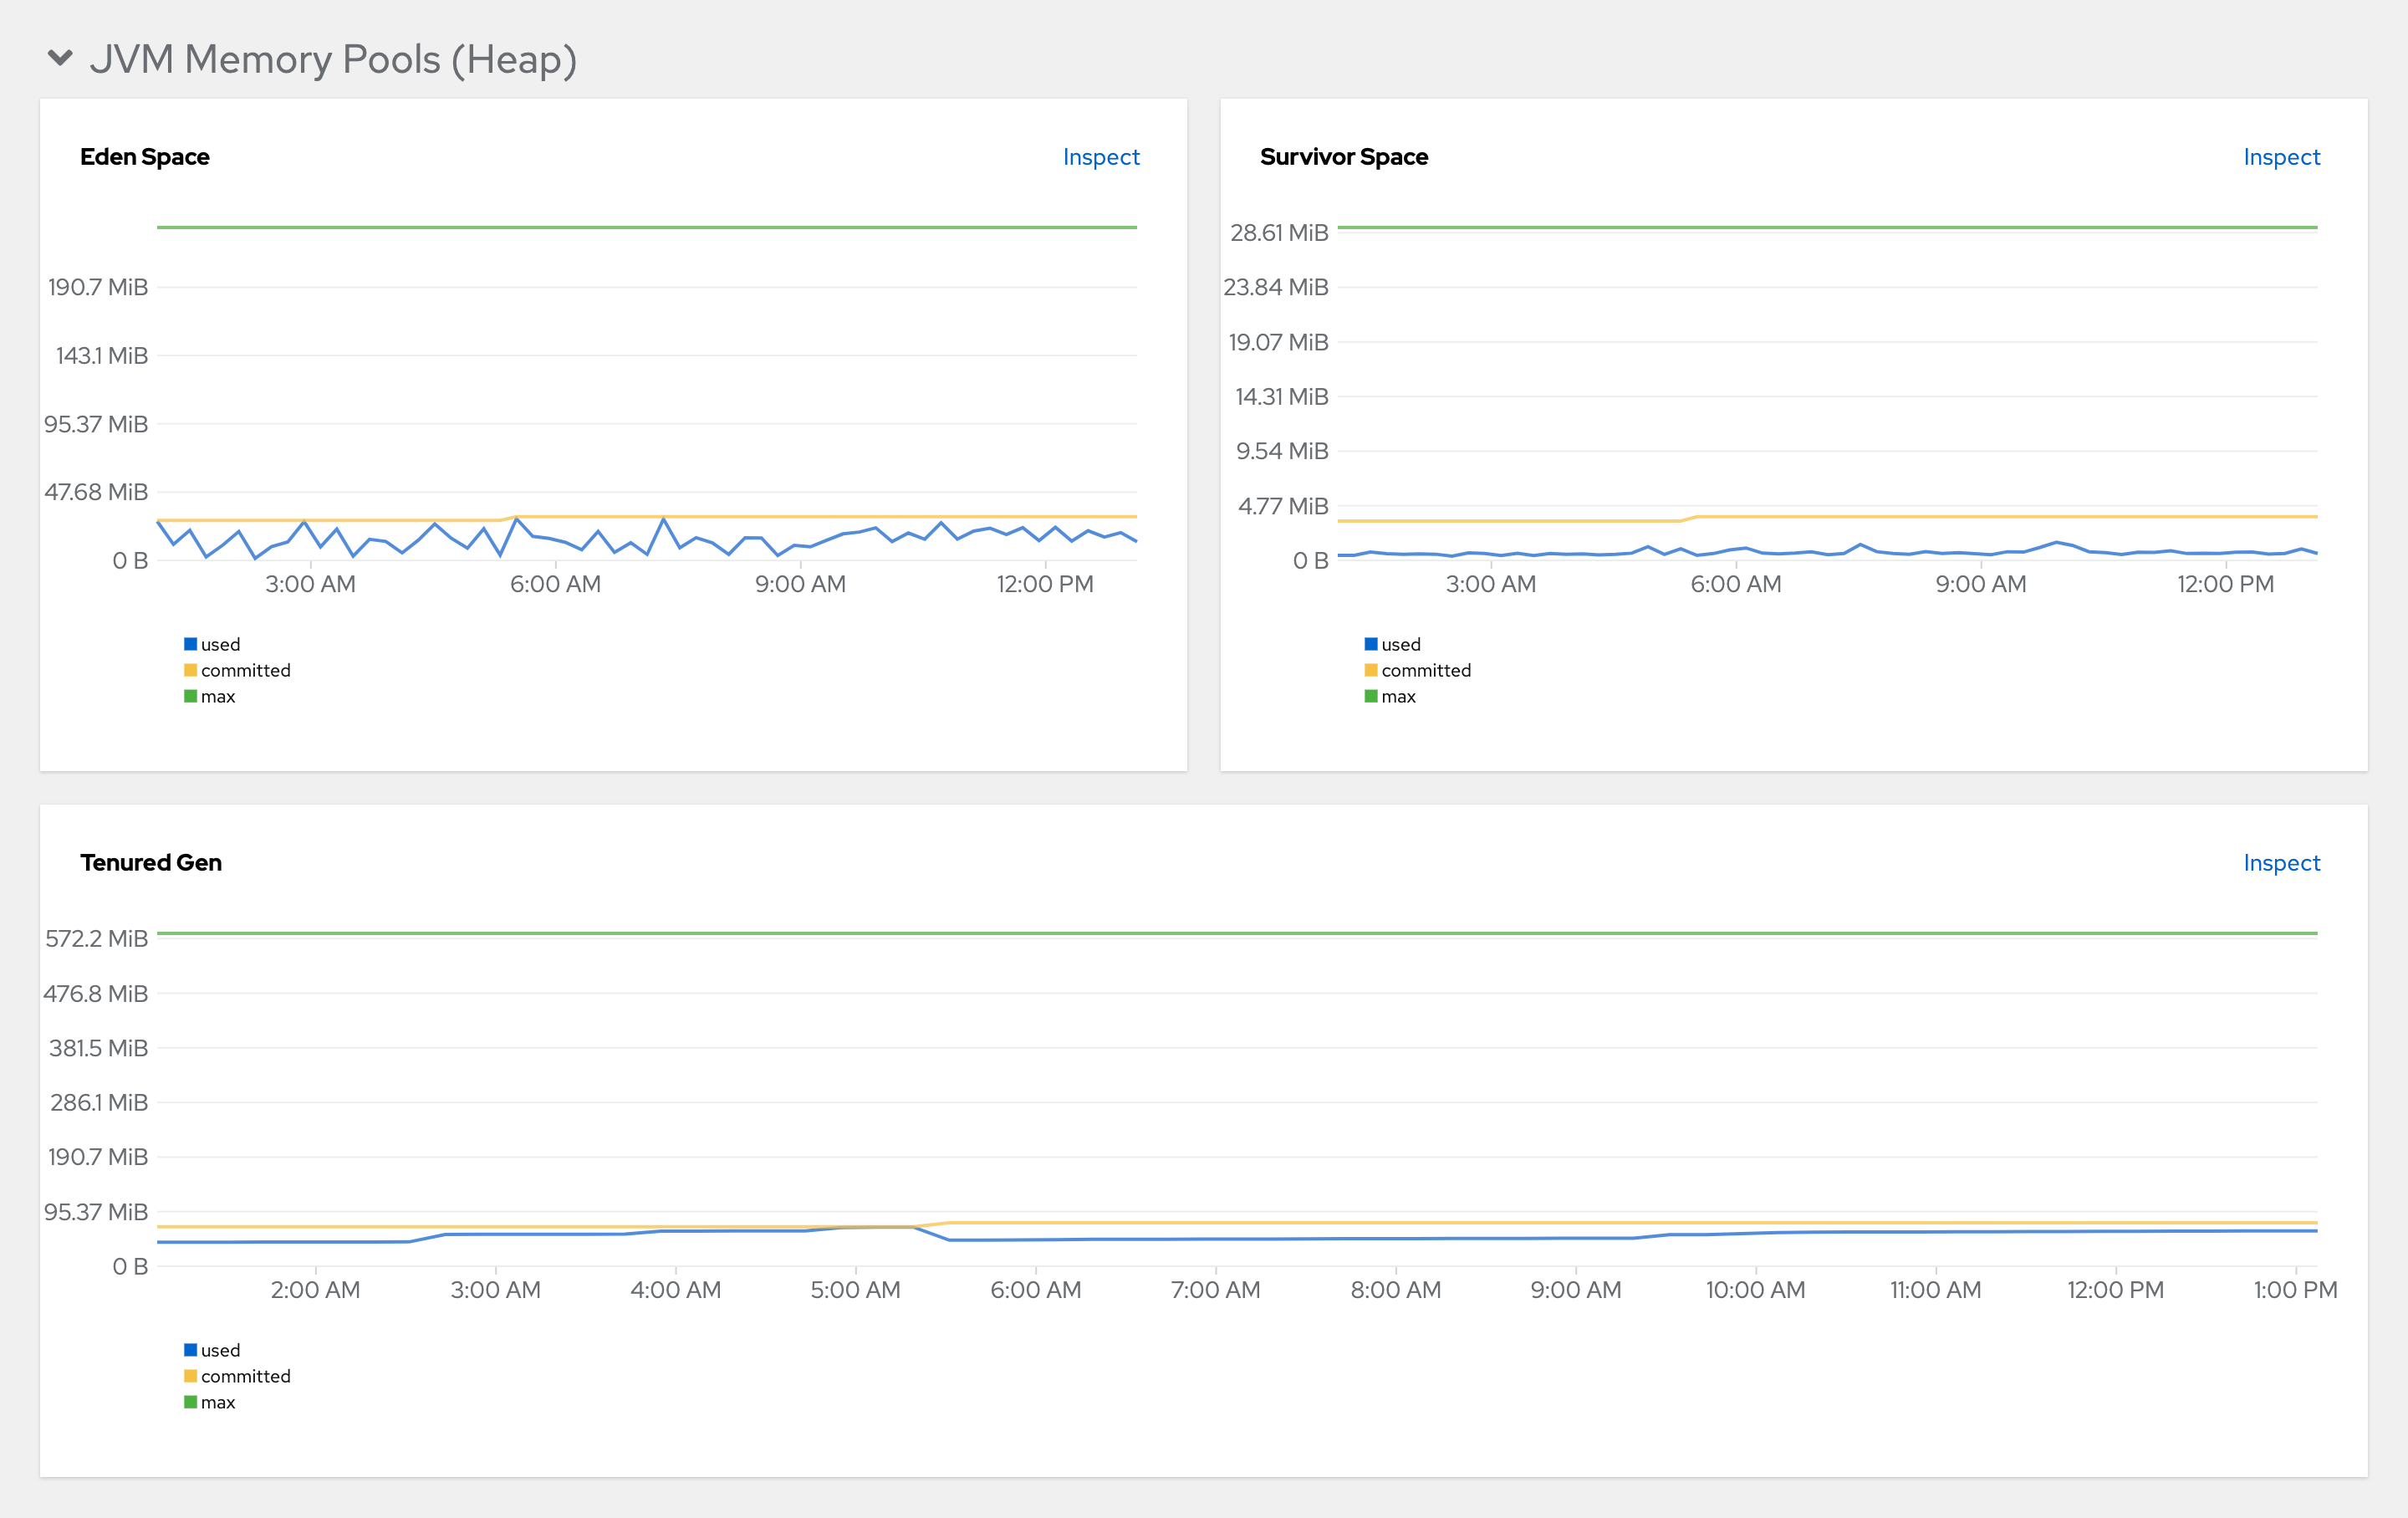 Figure 4. JVM Memory Pools (heap)
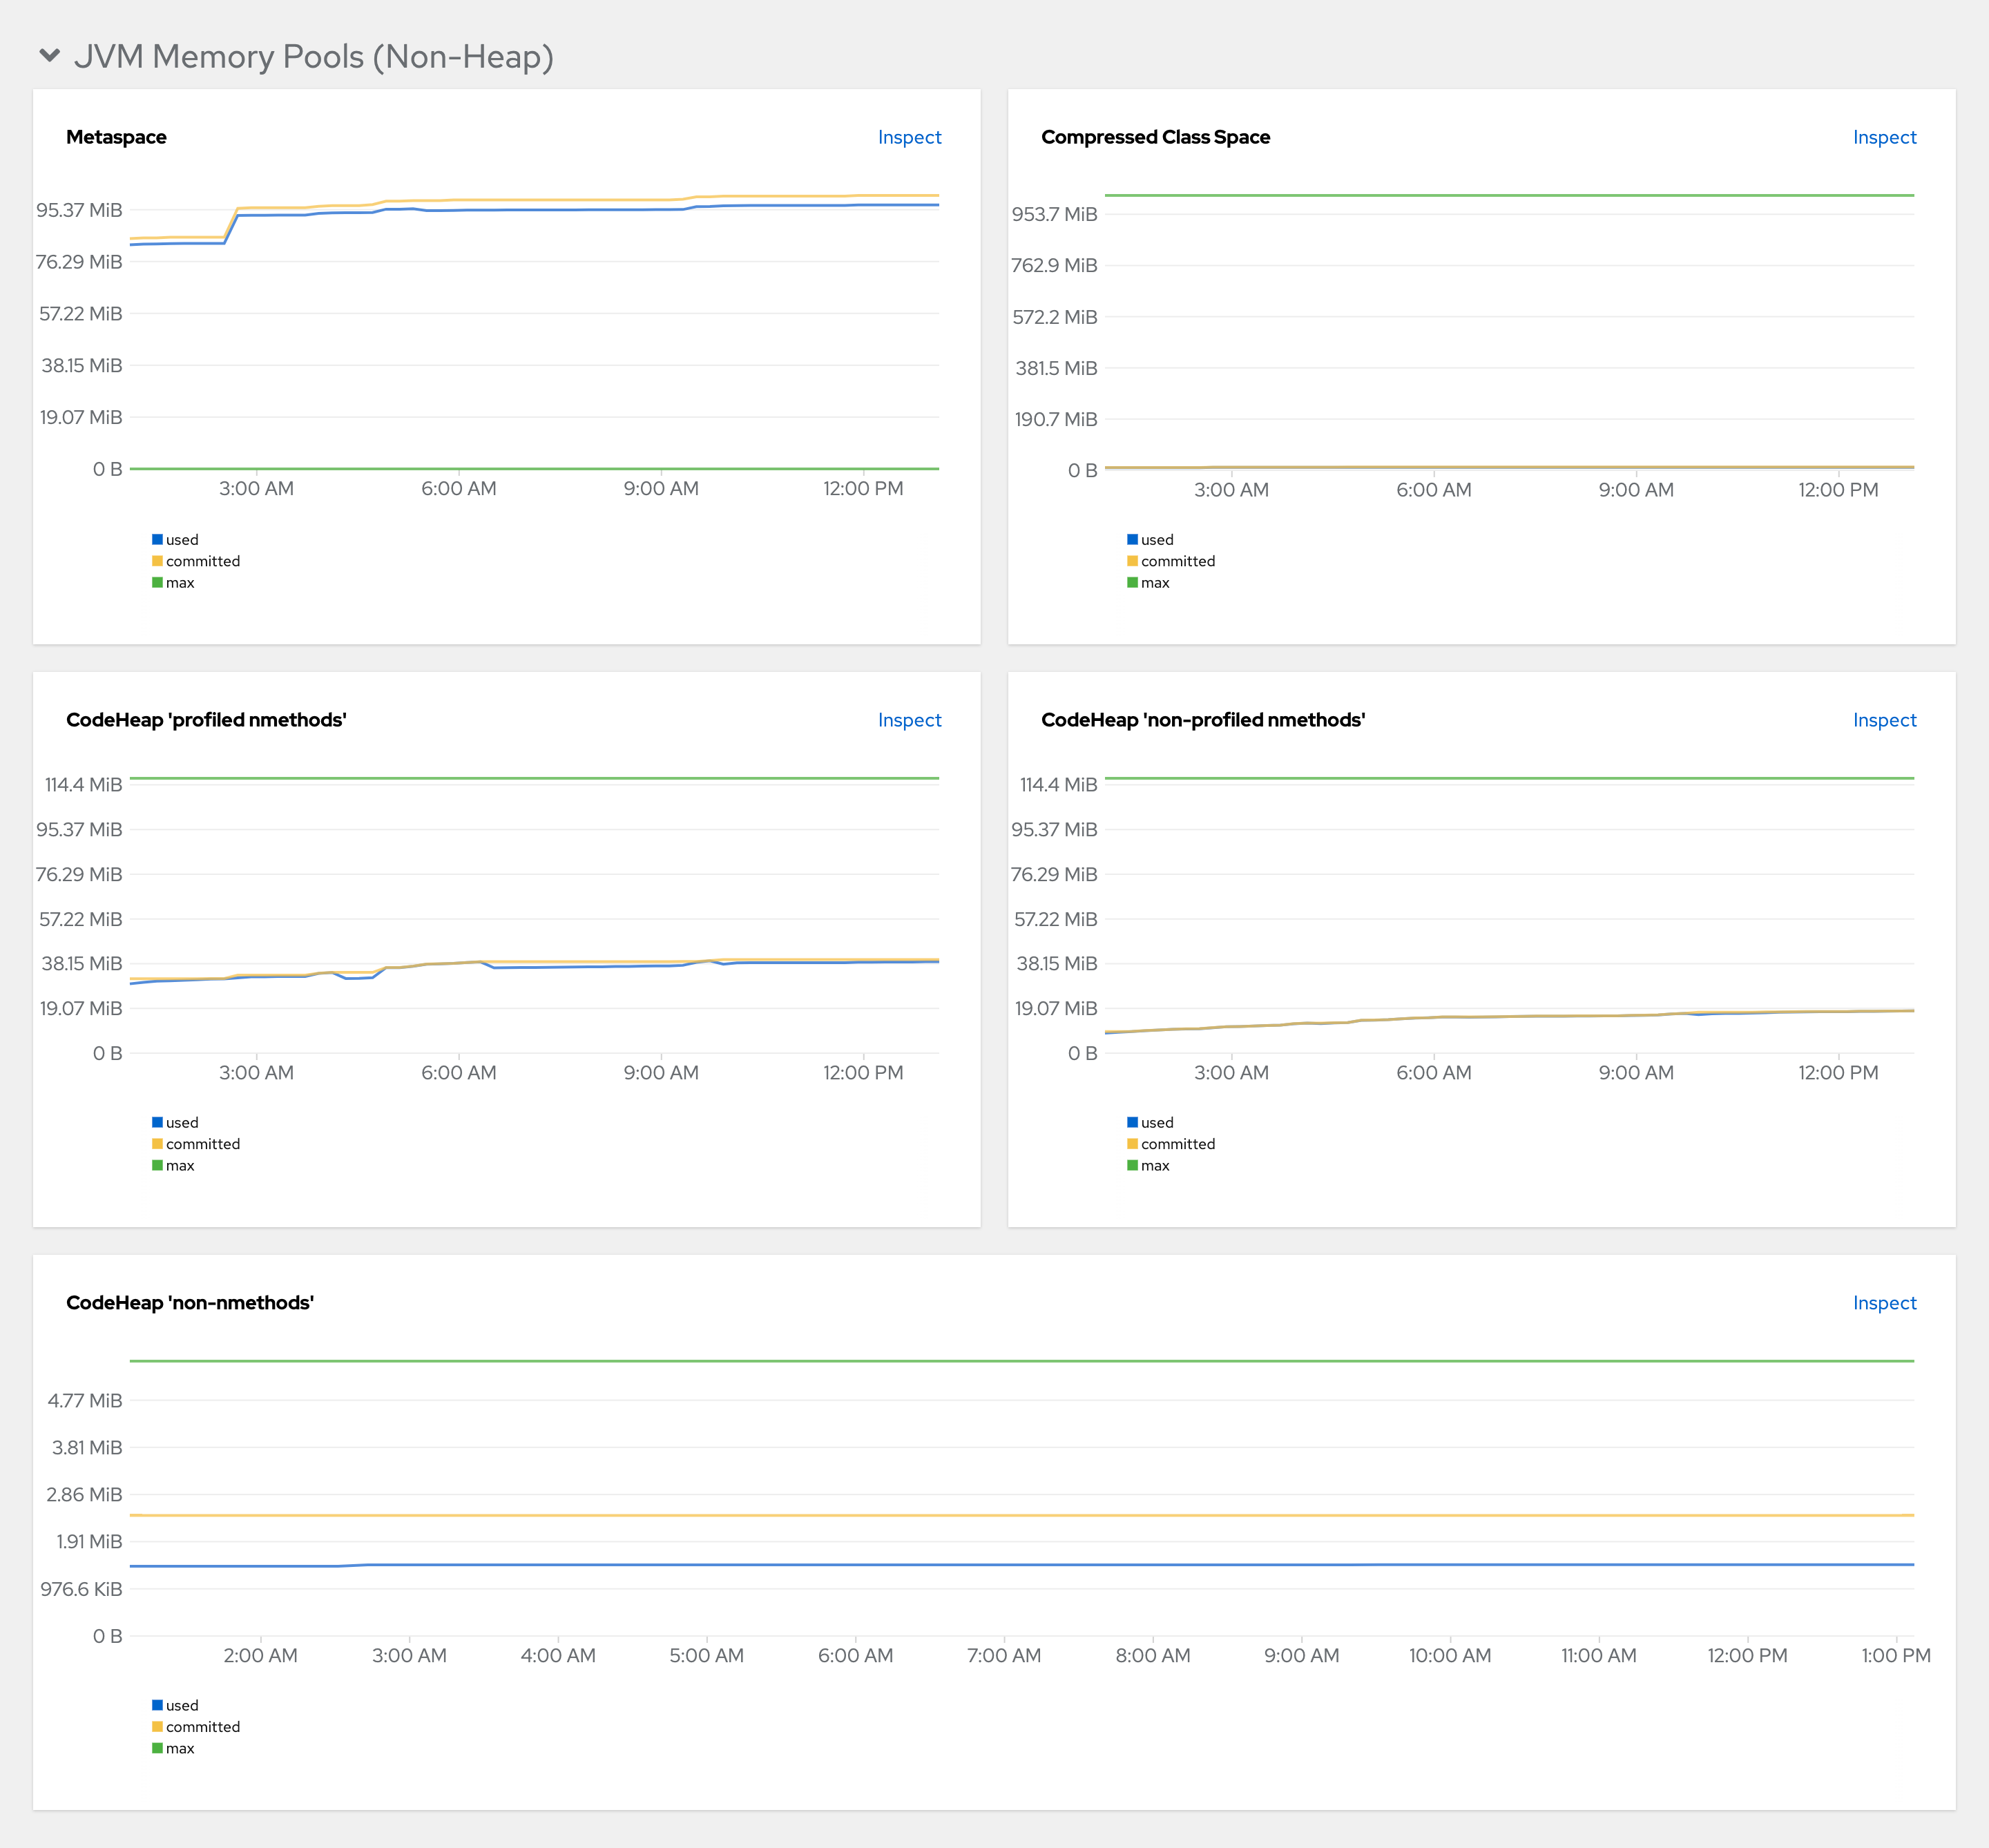 Figure 5. JVM Memory Pools (Non-Heap)
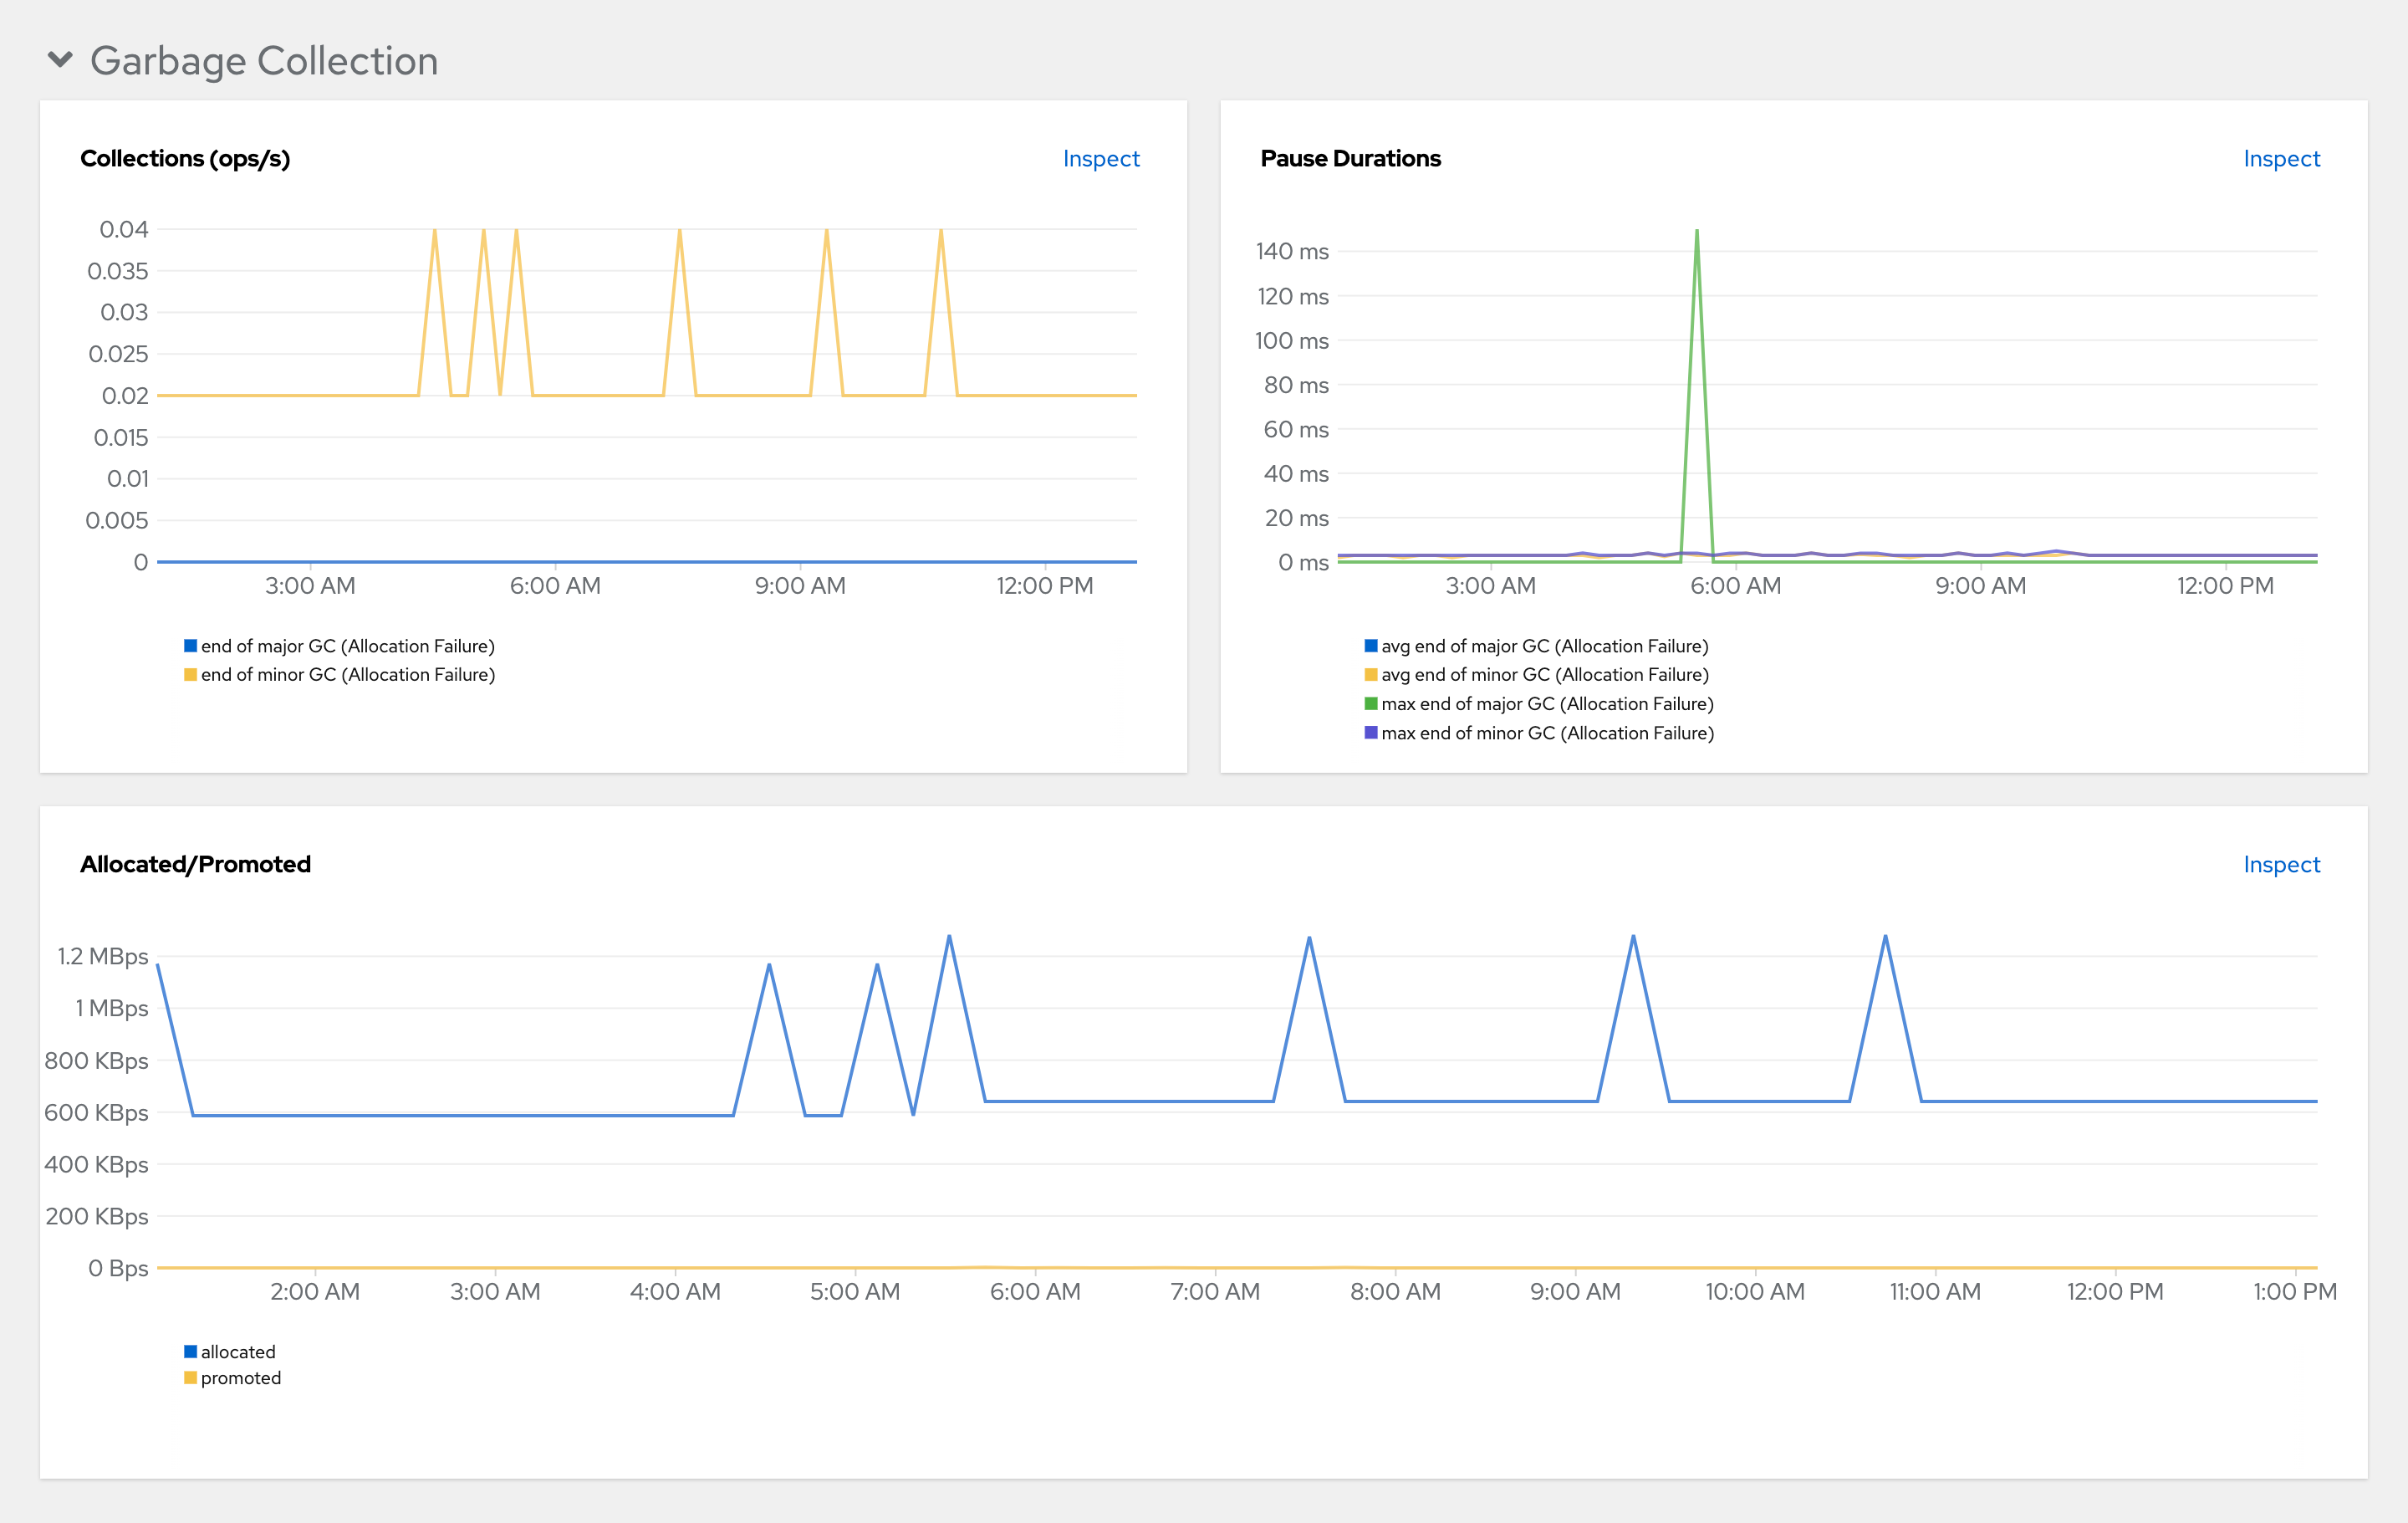 Figure 6. Garbage Collection
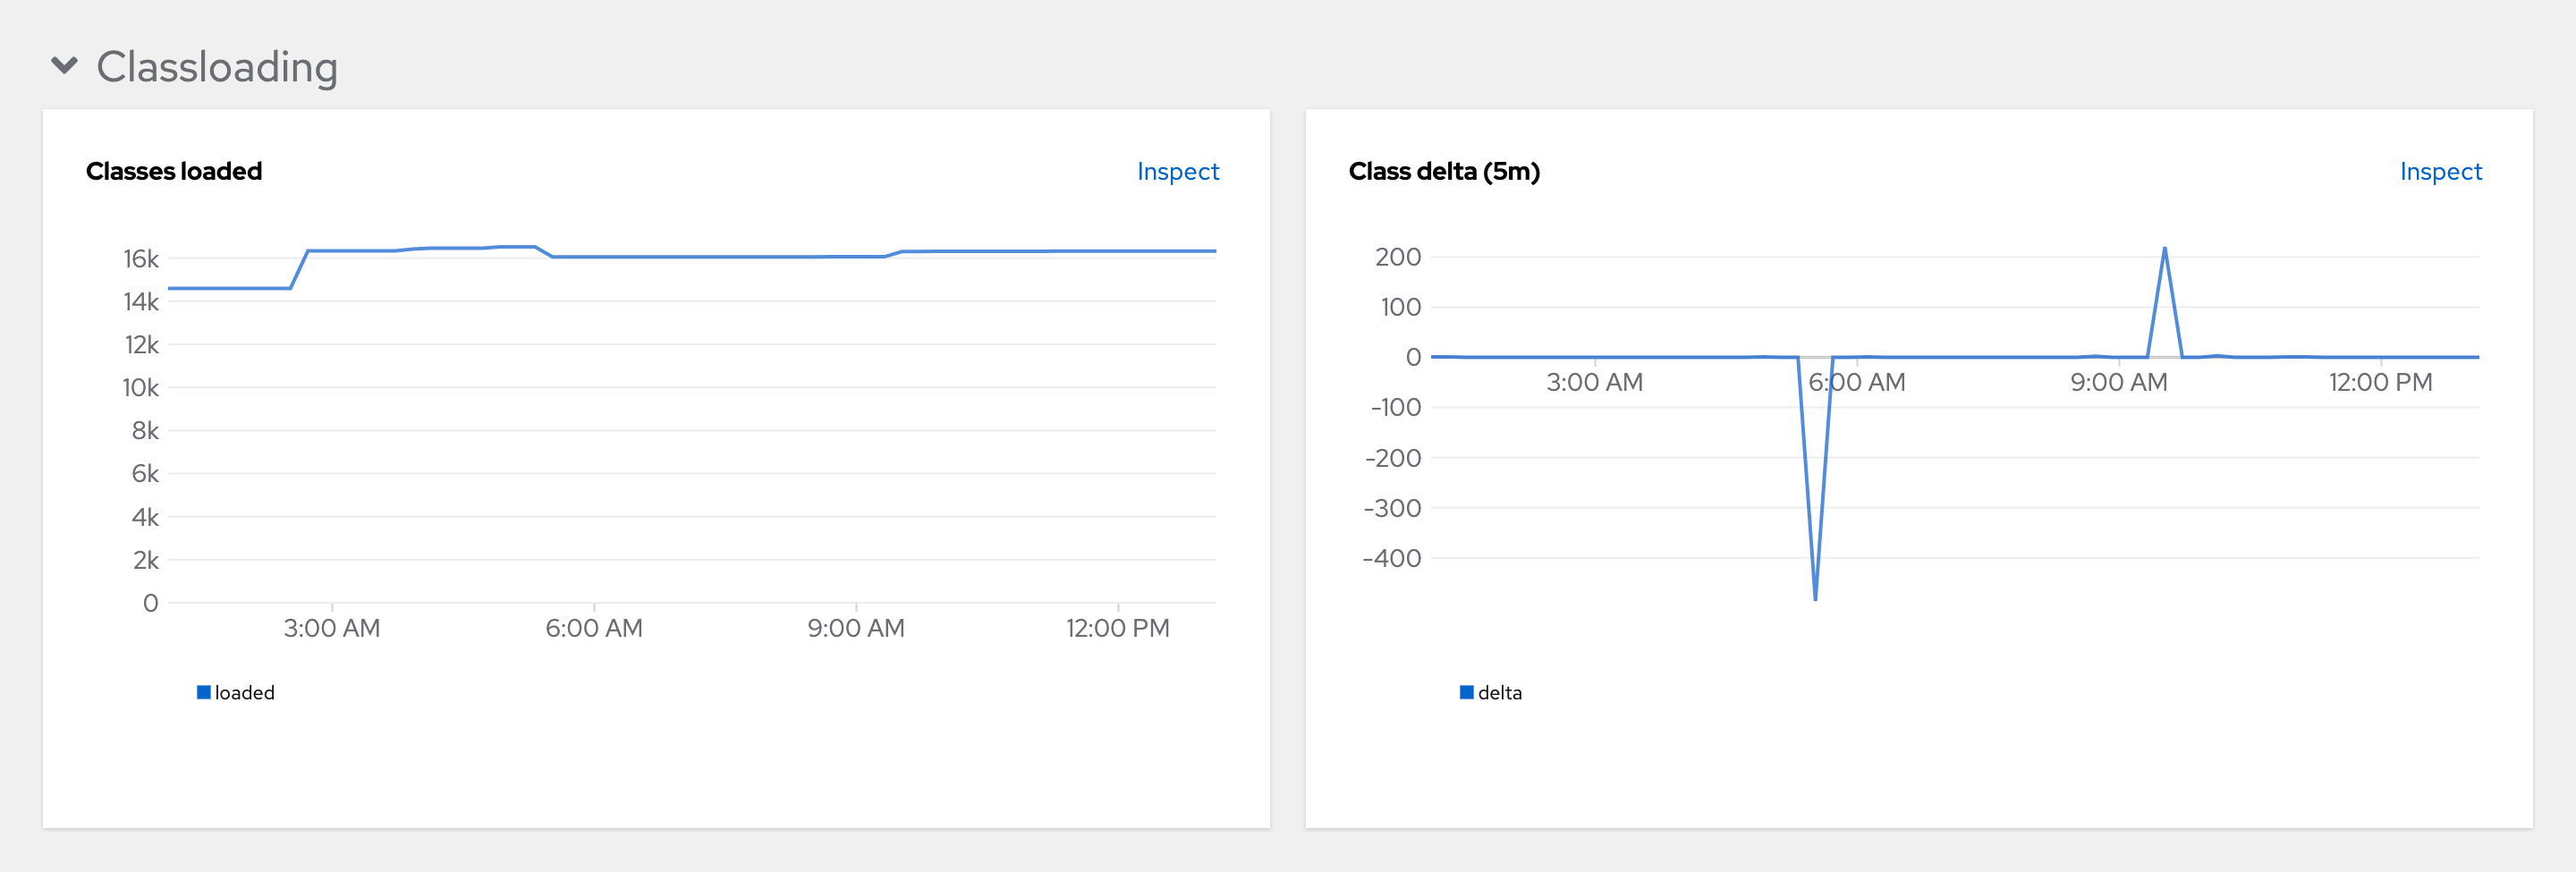 Figure 7. Class loading
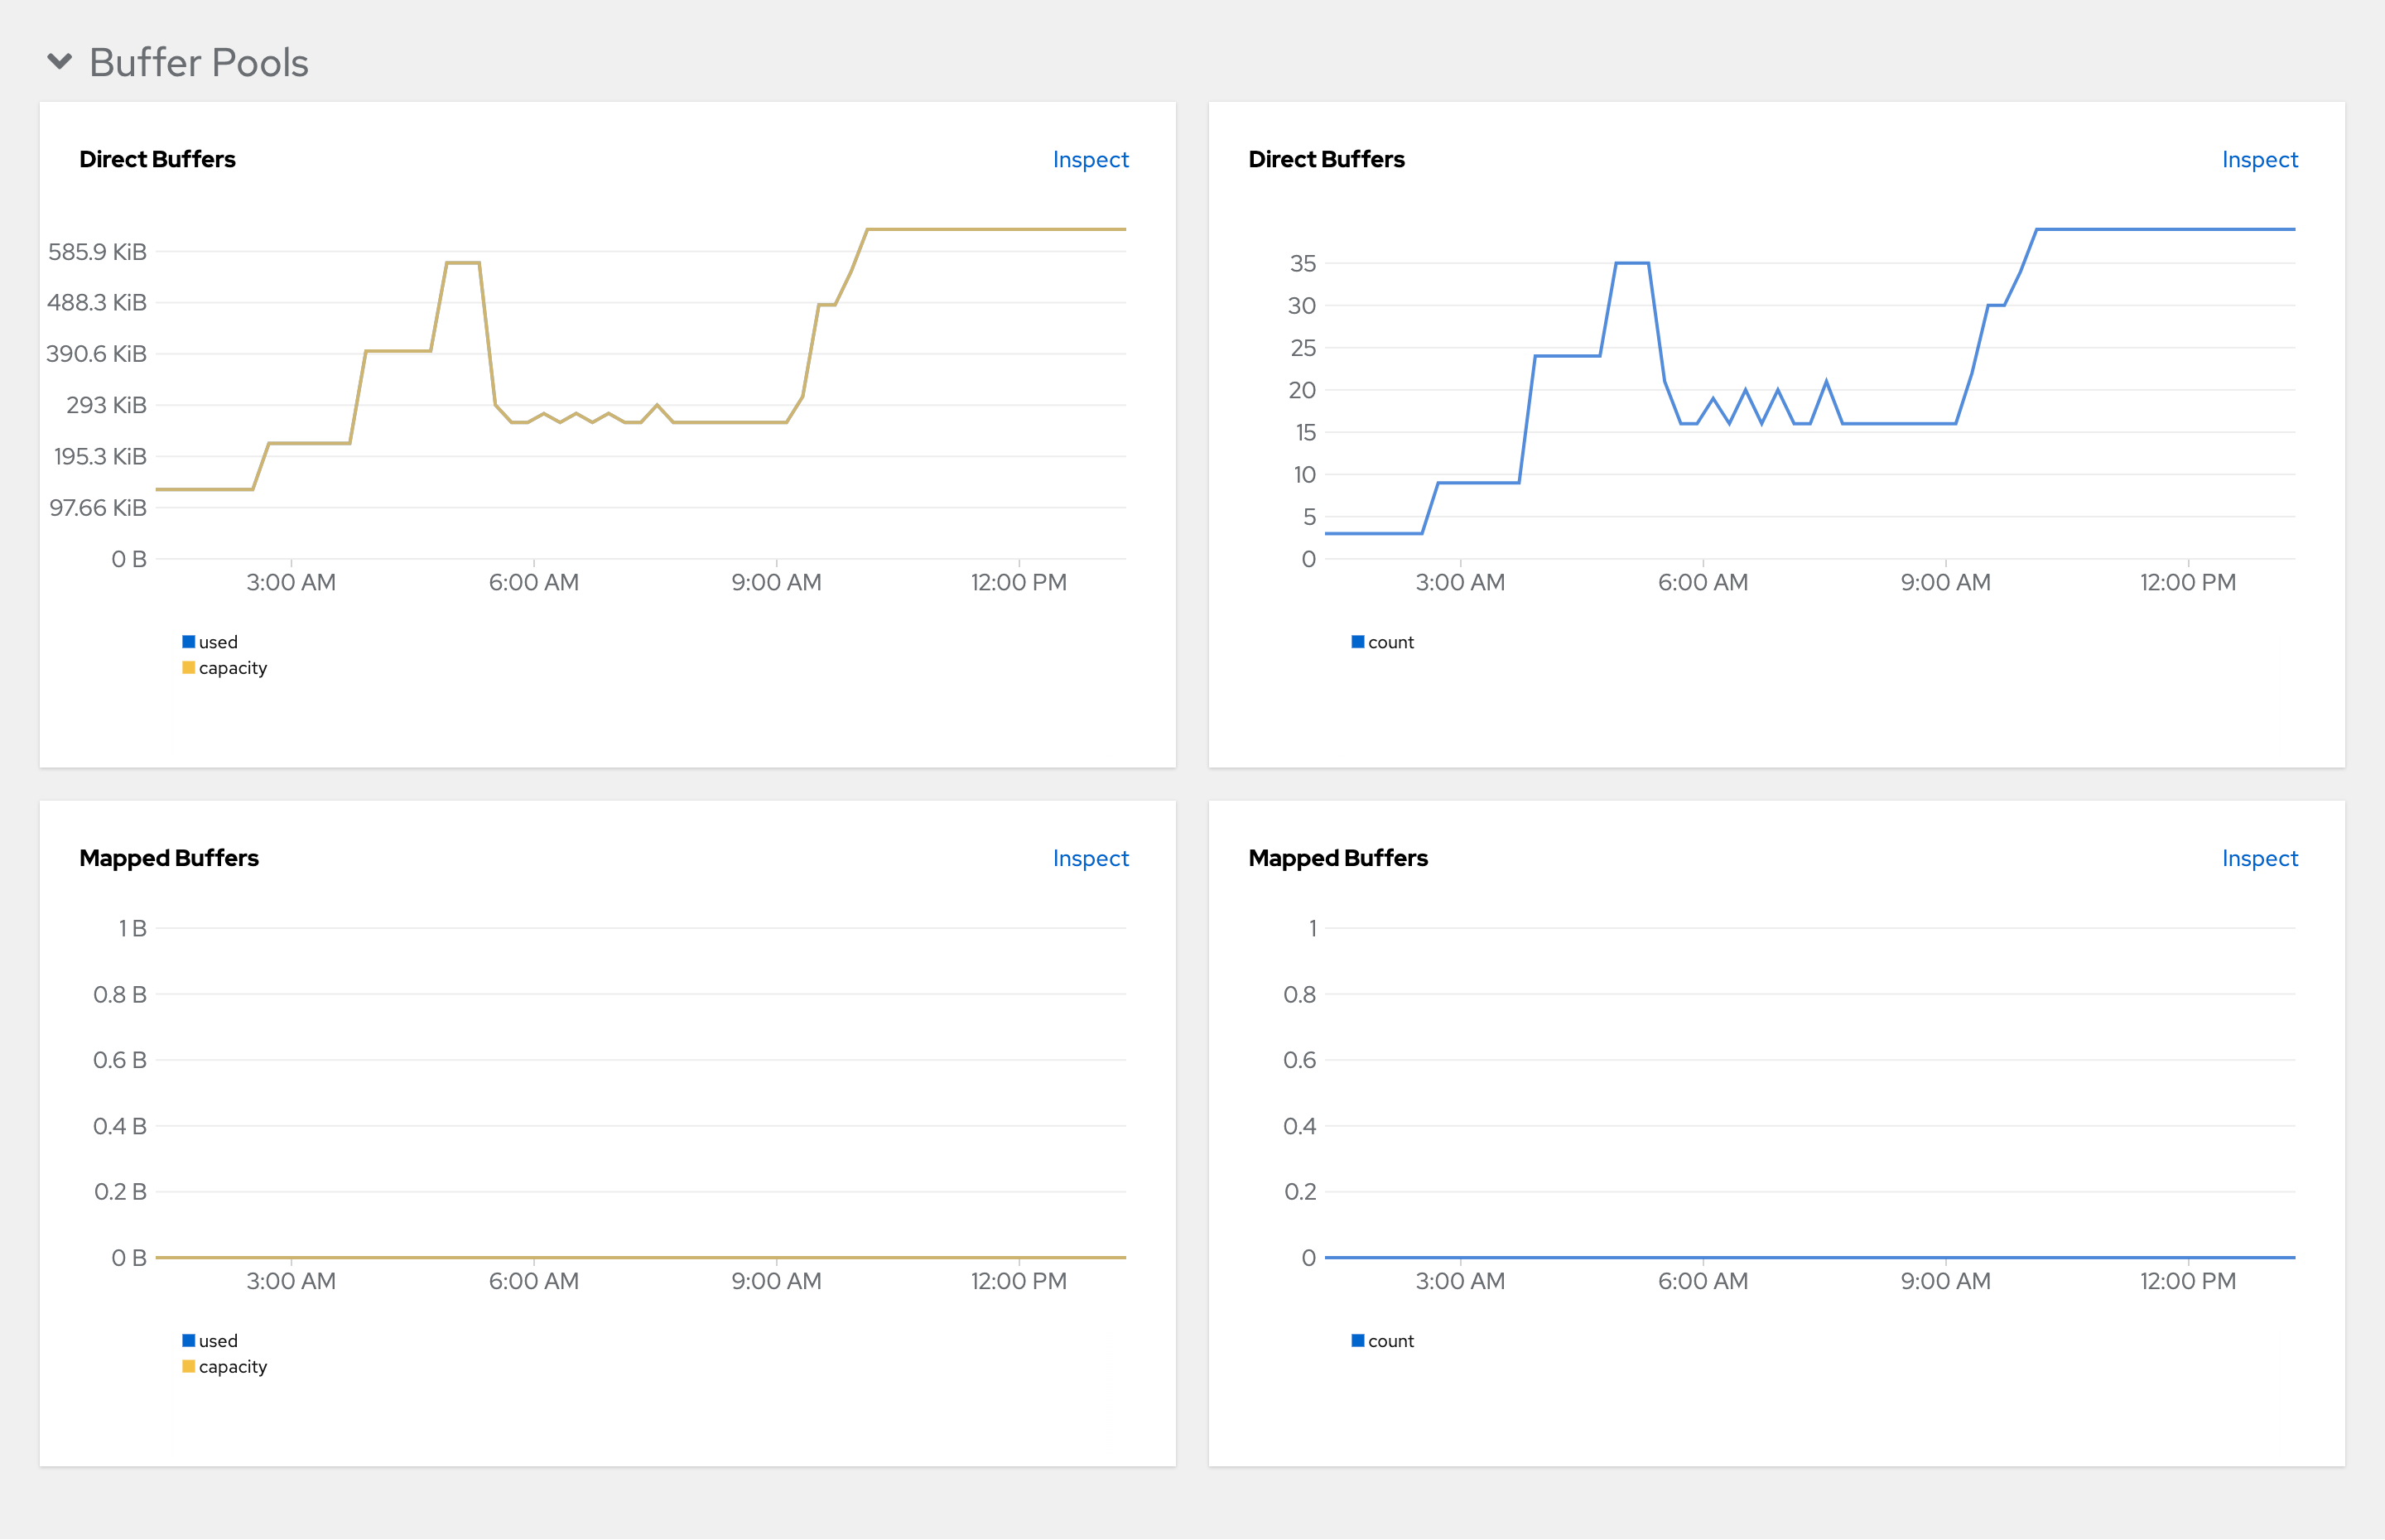 Figure 8. Buffer Pools