Monitor the DevWorkspace Operator
The DevWorkspace Operator exposes workspace startup, failure, and performance metrics on port 8443 on the /metrics endpoint of the devworkspace-controller-metrics Service. The Kubernetes in-cluster monitoring stack can scrape these metrics to help administrators track workspace health and diagnose startup failures.
Verify DevWorkspace Operator metrics with Prometheus
Verify that DevWorkspace Operator metrics are available in Prometheus. The che-operator automatically creates and reconciles the required Prometheus resources (ServiceMonitor, Role, and RoleBinding) and configures namespace labeling.
-
For a fresh installation of Che, generate metrics by creating a Che workspace from the Dashboard.
-
In the Administrator view of the OpenShift web console, go to Observe → Metrics.
-
Run a PromQL query to confirm that the metrics are available. For example, enter
devworkspace_started_totaland click Run queries.For more metrics, see DevWorkspace Operator metrics reference.
|
To troubleshoot missing metrics, view the Prometheus container logs for possible RBAC-related errors:
|
DevWorkspace Operator metrics reference
The following tables describe the DevWorkspace-specific metrics exposed by the devworkspace-controller-metrics Service.
| Name | Type | Description | Labels |
|---|---|---|---|
|
Counter |
Number of DevWorkspace starting events. |
|
|
Counter |
Number of DevWorkspaces successfully entering the |
|
|
Counter |
Number of failed DevWorkspaces. |
|
|
Histogram |
Total time taken to start a DevWorkspace, in seconds. |
|
| Name | Description | Values |
|---|---|---|
|
The |
|
|
The |
|
|
The workspace startup failure reason. |
|
| Name | Description |
|---|---|
|
Startup failure due to an invalid devfile used to create a DevWorkspace. |
|
Startup failure due to the following errors: |
|
Unknown failure reason. |
View DevWorkspace Operator metrics from an Kubernetes console dashboard
View DevWorkspace Operator metrics on a custom dashboard in the Administrator perspective of the Kubernetes web console. This dashboard helps you monitor operator health and detect workspace provisioning issues.
-
Che is installed and running on a Red Hat OpenShift cluster.
-
An active
ocsession with administrative permissions to the destination OpenShift cluster. See Getting started with the CLI. -
The in-cluster Prometheus instance is collecting metrics. See Verify DevWorkspace Operator metrics with Prometheus.
-
Create a ConfigMap for the dashboard definition in the
openshift-config-managednamespace and apply the necessary label.-
$ oc create configmap grafana-dashboard-dwo \ --from-literal=dwo-dashboard.json="$(curl https://raw.githubusercontent.com/devfile/devworkspace-operator/main/docs/grafana/openshift-console-dashboard.json)" \ -n openshift-config-managed -
$ oc label configmap grafana-dashboard-dwo console.openshift.io/dashboard=true -n openshift-config-managedThe dashboard definition is based on Grafana 6.x dashboards. Not all Grafana 6.x dashboard features are supported in the OpenShift web console.
-
-
In the Administrator view of the OpenShift web console, go to Observe → Dashboards.
-
Go to Dashboard → Dev Workspace Operator and verify that the dashboard panels contain data.
DevWorkspace Operator dashboard panels
The OpenShift web console custom dashboard is based on Grafana 6.x and displays the following metrics from the DevWorkspace Operator.
| Not all features for Grafana 6.x dashboards are supported as an OpenShift web console dashboard. |
DevWorkspace metrics
The DevWorkspace-specific metrics are displayed in the DevWorkspace Metrics panel.
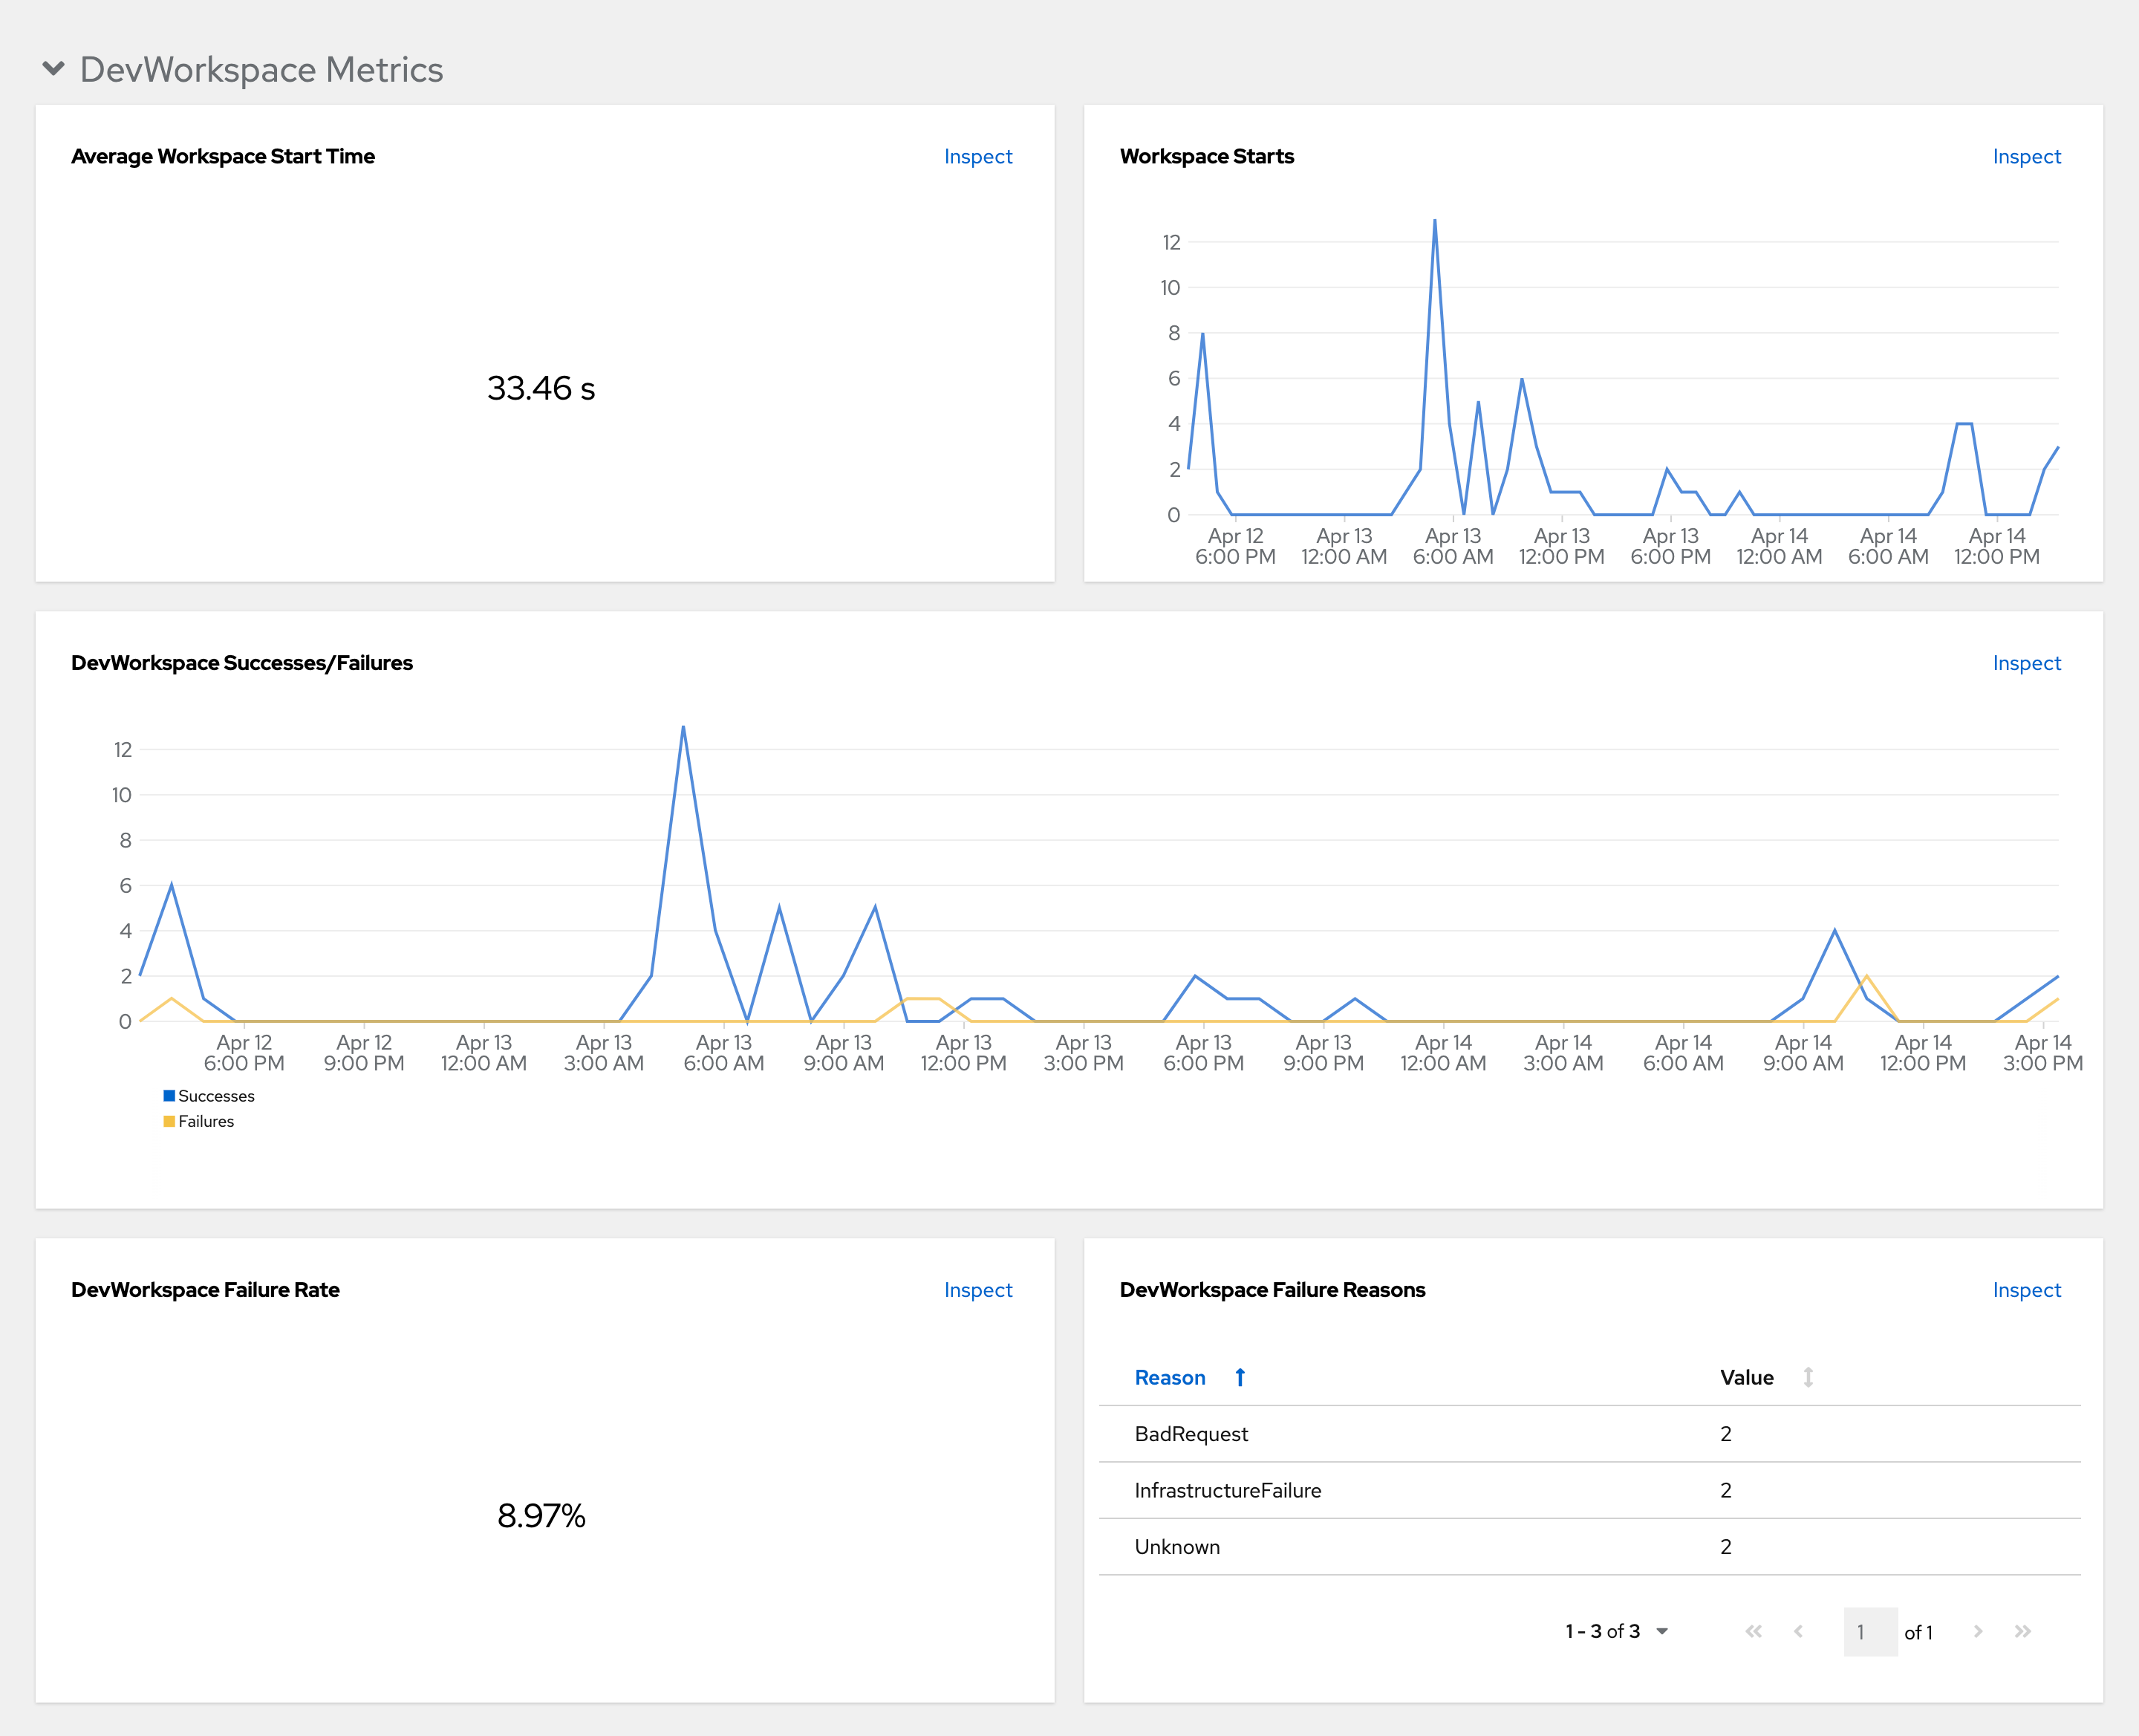
- Average workspace start time
-
The average workspace startup duration.
- Workspace starts
-
The number of successful and failed workspace startups.
- DevWorkspace successes and failures
-
A comparison between successful and failed DevWorkspace startups.
- DevWorkspace failure rate
-
The ratio between the number of failed workspace startups and the number of total workspace startups.
- DevWorkspace startup failure reasons
-
A pie chart that displays the distribution of workspace startup failures:
-
BadRequest -
InfrastructureFailure -
Unknown
-
Operator metrics
The Operator-specific metrics are displayed in the Operator Metrics panel.
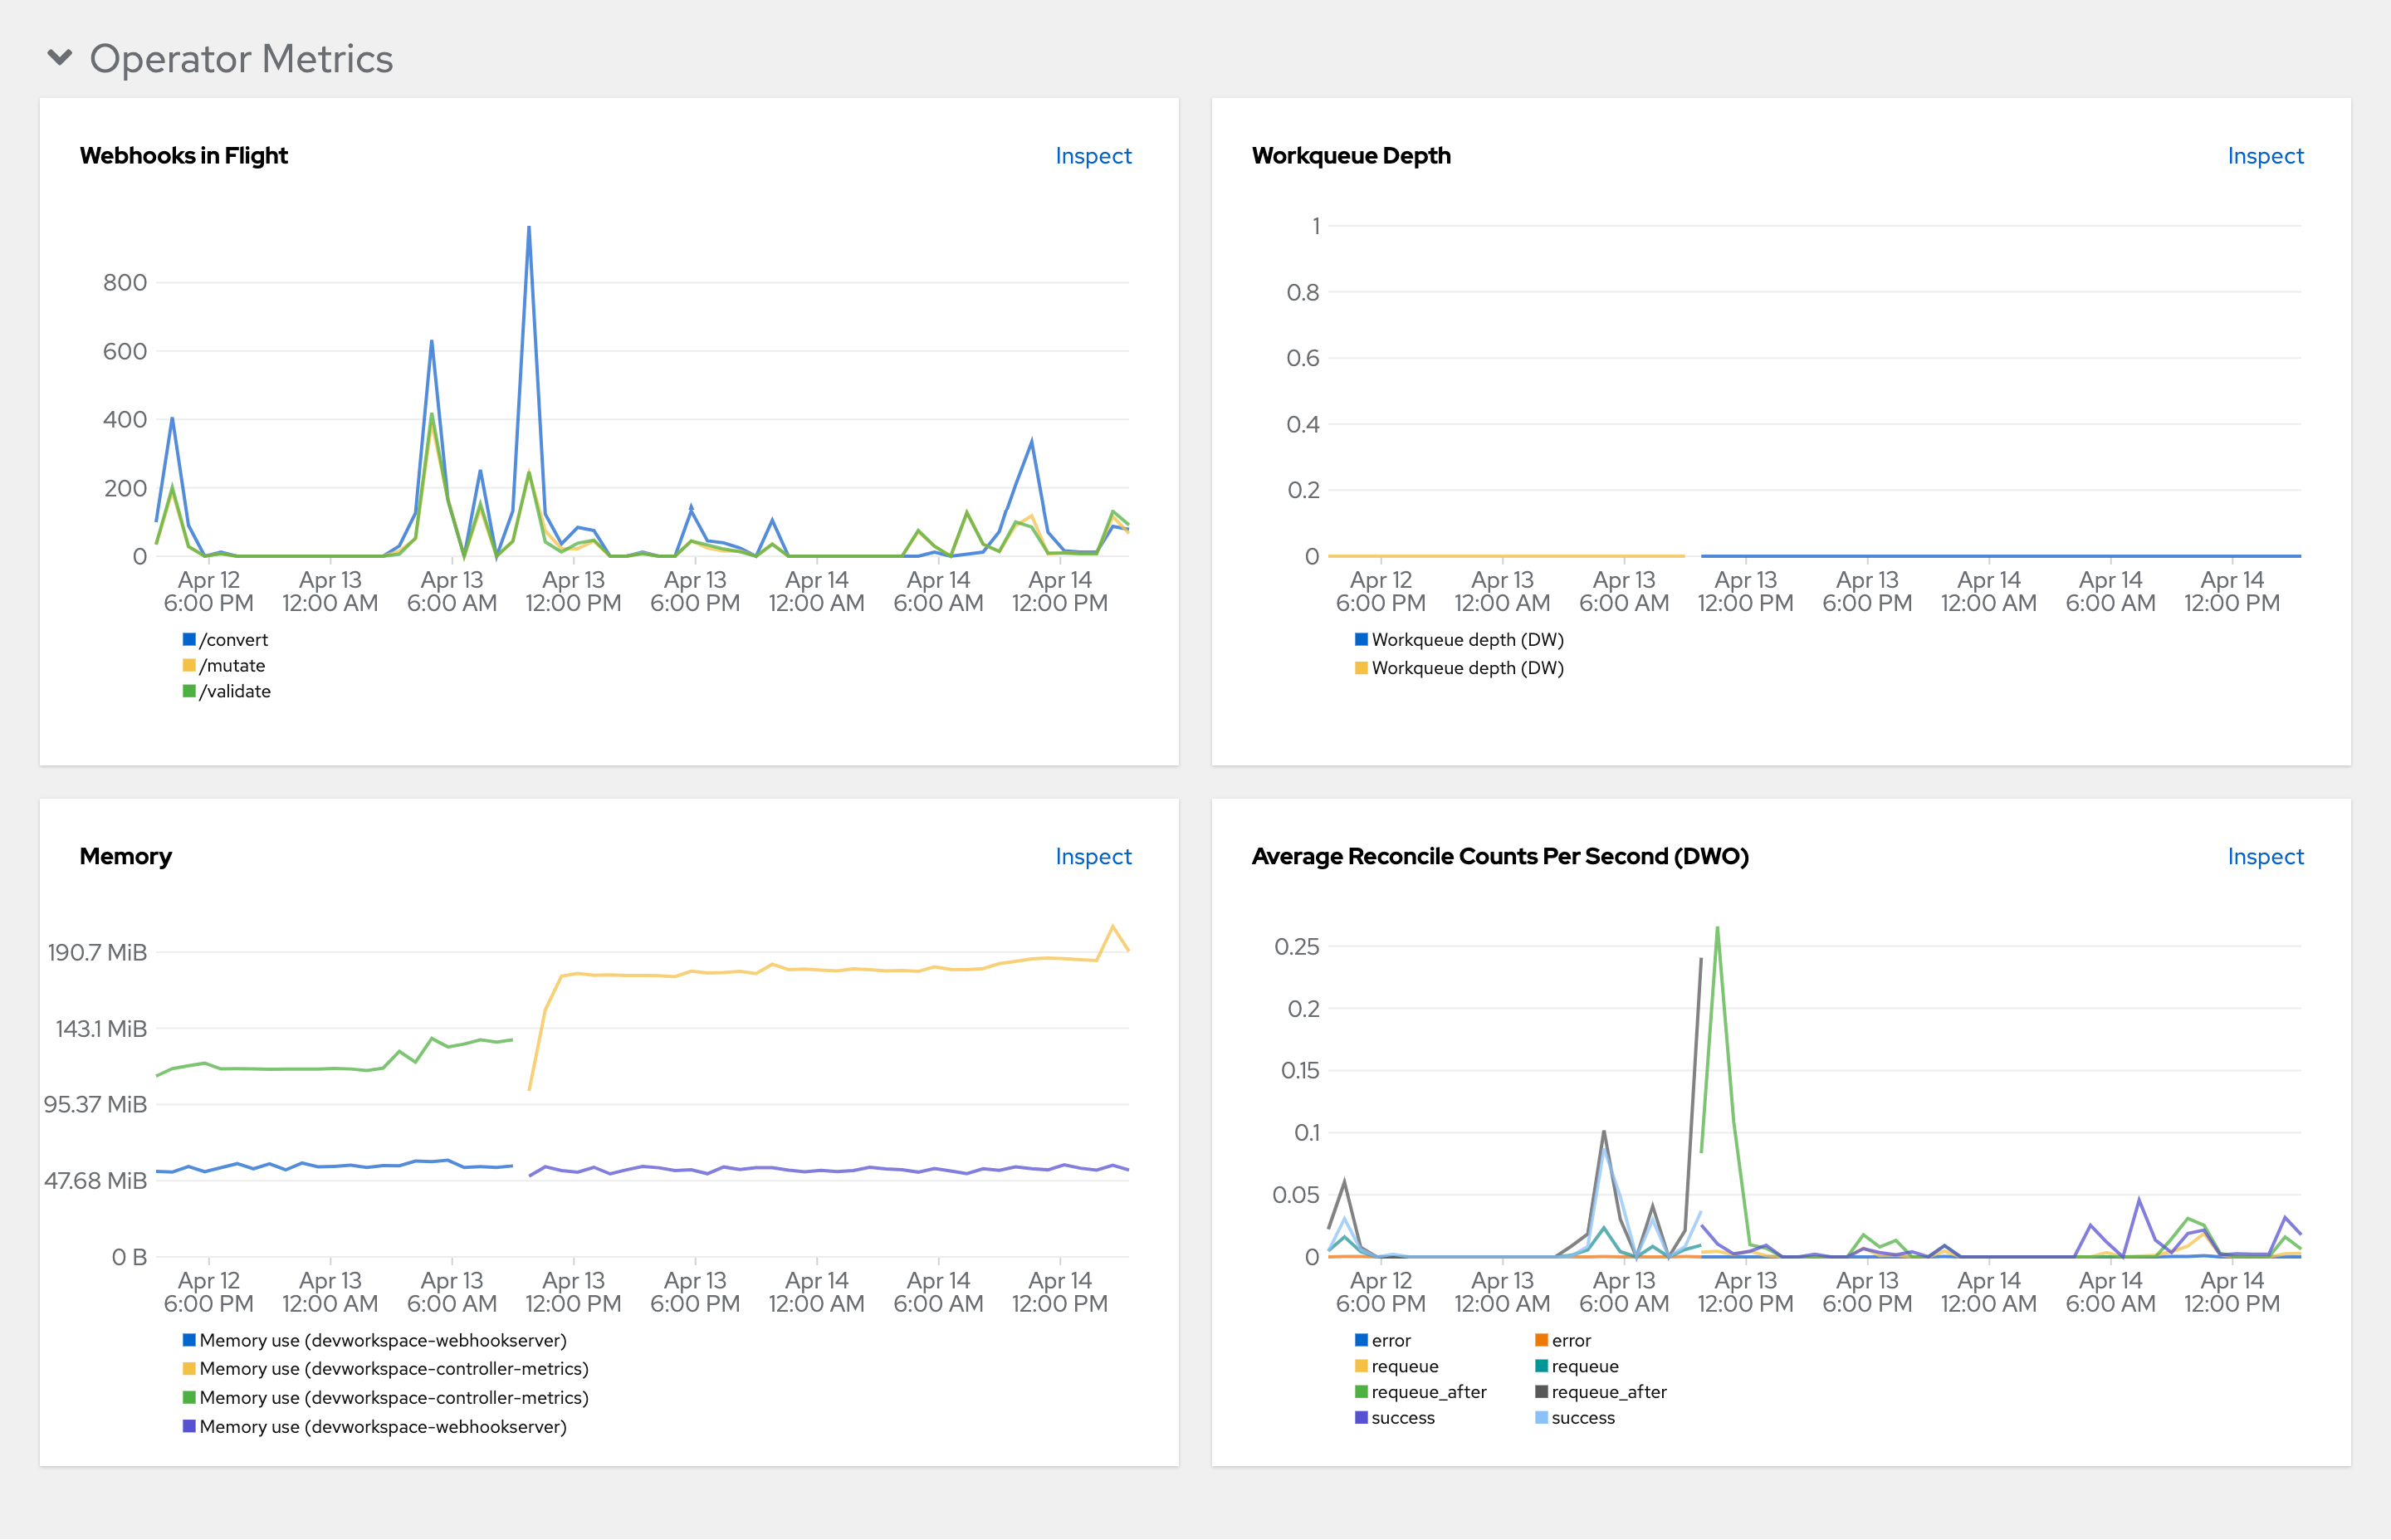
- Webhooks in flight
-
A comparison between the number of different webhook requests.
- Work queue depth
-
The number of reconcile requests that are in the work queue.
- Memory
-
Memory usage for the DevWorkspace controller and the DevWorkspace webhook server.
- Average reconcile counts per second (DWO)
-
The average per-second number of reconcile counts for the DevWorkspace controller.